


How do the four stages of passage planning – appraise, plan, execute, monitor (APEM) – work in the age of the chartplotter? Craig Burton, head of training operations at the Royal Yachting Association (RYA) shares his advice on using waypoints.
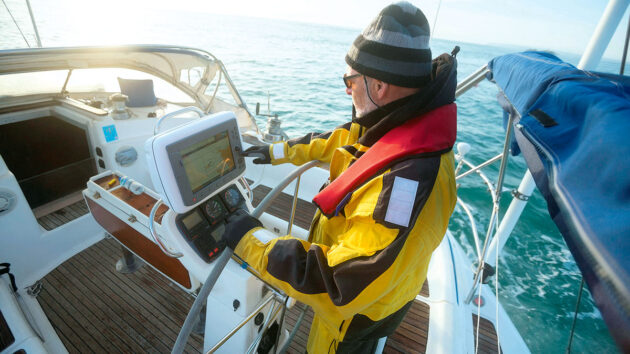
The electronic chart system (ECS) is a key aid to creating a passage plan that allows us access to all the necessary information throughout the passage.
Access to this information is essential for monitoring progress and for signposting each step of the plan.
To be clear, we aren’t just adding a route; we are adding as much of the whole plan to the ECS as possible.
Of course, there are no reasons why we cannot continue to use pen and paper, but by using an ECS all watchkeepers have access to key information, particularly on chart displays at the helm position.
Waypoint best practice: markers for action
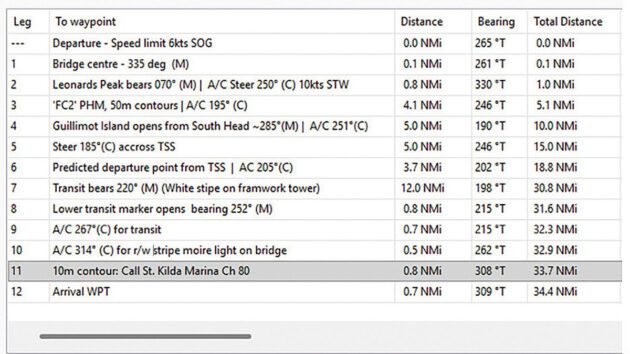
Figure 1: Describe the waypoint in its name. Credit: RYA
Key to this is the way we consider the humble waypoint.
If we focus on waypoints being a marker for an action or decision then the waypoints can be given a descriptive name, such as a change in speed limit, an alteration of course, a prompt to call harbour control with the appropriate VHF channel.
A planning waypoint list might look like figure 1 (above).
Depending on the particular system you’re using, you can use a standalone waypoint for additional information, such as tidal heights approaching a harbour.
Some systems allow comment boxes or areas, as illustrated in figure 2 (below).
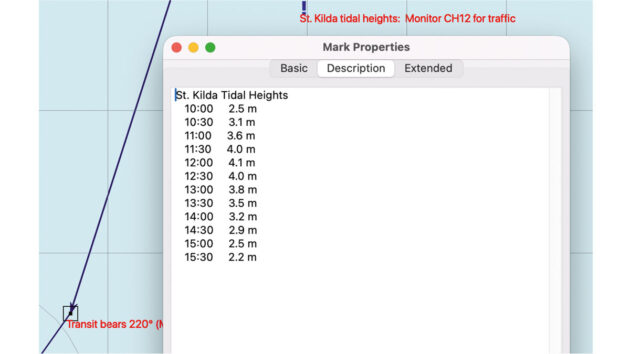
Figure 2: Some ECS’s have options to include further details against a waypoint. Credit: RYA
Waypoint myth-busting
A common misconception about using waypoints and routes in an ECS is that you then become a slave to the route.
You should look on the route as a benchmark from which to monitor actual progress against predicted.
As an example of the use of routes and waypoints, let’s look at the middle section of a passage; we can see that there is a Traffic Separation Scheme (TSS) to be negotiated in figure 3 (below).
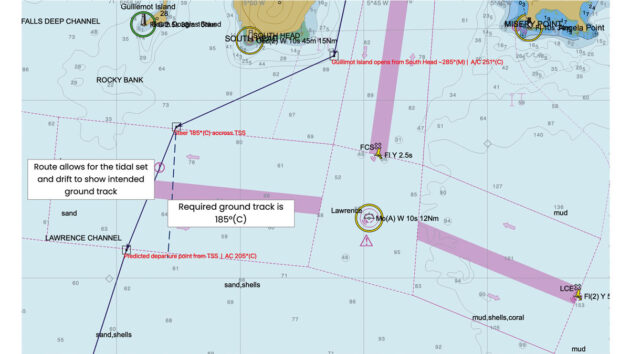
Figure 3: This route involves negotiating a Traffic Separation Scheme (TSS) which can be managed in your plan. Credit: RYA
The section to the west of the north/south traffic lanes is relatively narrow (1.2 miles between the traffic lane and the dark grey safety contour) and therefore could benefit from having a set cross track distance (XTD), also known as cross track error (XTE).
This would help us to monitor how close we are to the shallow water and the TSS itself.
In this instance, we chose an XTD of 0.4 miles on both sides of the route.
In setting an XTD/XTE we need to ensure any waypoint arrival trigger radius is compatible with the XTD.
If the XTD is larger than the waypoint arrival radius your vessel may not trigger the alarm.
Many systems are intelligent enough to manage this, but it is worth getting into the habit of checking these things.
Note that the waypoint labelled red ‘Guillemot Island opens from South Head…’ at the end of this leg gives a course to steer but also a separate line of position of the island opening behind the headland.
This is an independent verification using a line of position, which is still relevant in the digital age.
In fact, it is a requirement within the APEM framework during the monitoring phase.
For the leg crossing the east/west lanes, we identify a course to steer of 185° (C) to cross at 90° to the lanes as required under the International Regulations for Preventing Collisions at Sea (IRPCS), but plot the predicted ground track to give an indication of the exit point.
In this case, the TSS is only 3.5 miles across and we would cross it in around 20 minutes at our cruising speed of 10 knots, so the cross current can be taken as a single figure.
East and west drift
With a slower vessel or a larger distance to cross we are more likely to have elements of east and west drift.
Having the specific XTD east drift and west drift will enable you to see if we have drifted more one way than expected so we can reassess our departure point.
Figure 4 (below) gives a scenario where the west drift is 0.9 miles and east is 0.2 miles, giving a predicted net drift 0.7 miles to the west.
Setting an XTD to the west of 0.9 miles will allow us to monitor this west drift, with the expectation that we will then be set to the east later to give an exit from the TSS approximately 0.7 miles west of our entry point.
Another way to monitor progress along legs is a course over ground (COG) vector which can be set to a specific length or more commonly as a function of time, eg the vessel’s location in 30 minutes.
The COG vector not only gives an indication of where you expect to be in the future but can also give a sense of scale when using digital charts.
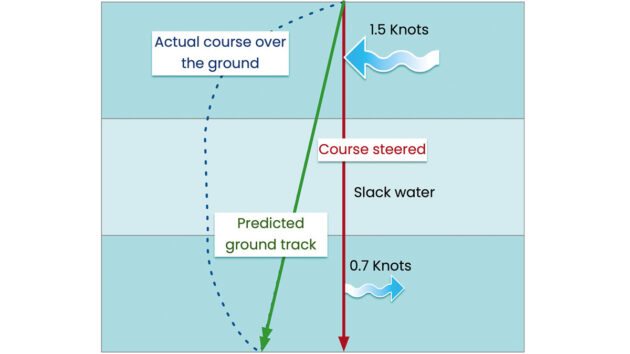
Figure 4: A COG vector helps the navigator keep track of passage progress. Credit: RYA
Modifying the vector setting
As with XTD, the setting for vector should be modified for different stages of a passage.
In pilotage waters a short time frame or length is likely to be best; on an offshore passage a longer time frame may be more appropriate.
Figure 5 gives an example of a COG vector indicating the set away from the desired route.
The green vector is the COG vector, with the red vector being the slightly less useful heading vector.
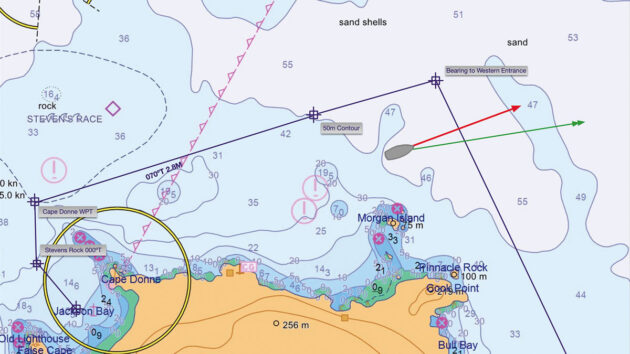
Figure 5: Setting a cross track distance will help to monitor drift. Credit: RYA
We can see that the track of the vessel has moved away from the route in line with the COG vector direction.
The navigator can see this trend as soon as the vessel begins tracking away from the route.
These key moments from a notional passage show how the safety and efficiency of a passage can be improved by making it available to the whole crew.
APEM: the key stages in passage planning
1. Appraise: gathering all information relevant to the intended passage.
2. Plan: detailed planning of the whole passage from berth to berth, mitigated for hazards and limiting factors.
3. Execute: at the point of executing the plan, we identify whether any of the assumptions or predictions used to create the plan have changed – for example, state of the vessel, fuel, stores, weather forecast, crew strength and experience.
4. Monitor: monitor the progress of the vessel against what was planned, and if modifications are required they should be made using the APEM principles.
For those not aware of these stages there is an overview available at: pbo.co.uk/voyage-planning
About the author

Craig Burton is head of training operations at the Royal Yachting Association (RYA)
PBO’s new eNav in a Nutshell series is supported by Navimaps.co.uk – experts in marine cartography – Navionics & Garmin Navionics for chartplotters.
Get the most out of your chartplotter with these setup tips
How often do you stop and really sit down with your chartplotter? Navigators are necessarily tunnel visioned once under way:…

Sailing by numbers: Are instruments dulling our seamanship?
Richard Thomson ponders whether we should be focusing less on the tech and more on sailing by the feel of…
How to link your smartphone to your navigation system
Considering a smart navigation system? The advance of electronics, and especially home automation, have given rise to a range of…
What to read more features like The humble waypoint?
A subscription to Practical Boat Owner magazine costs around 40% less than the cover price.
Print and digital editions are available through Magazines Direct – where you can also find the latest deals.
PBO is packed with information to help you get the most from boat ownership – whether sail or power.
-
-
-
- Take your DIY skills to the next level with trusted advice on boat maintenance and repairs
- Impartial, in-depth gear reviews
- Practical cruising tips for making the most of your time afloat
-
-
Follow us on Facebook, Instagram, TikTok and X